Metal Detecting Data: Spot Patterns Across Your Hunts
Finds per hunt, keeper rate, top locations, VDI distribution, depth bands — here is how simple stats reveal patterns your memory would miss.
Updated
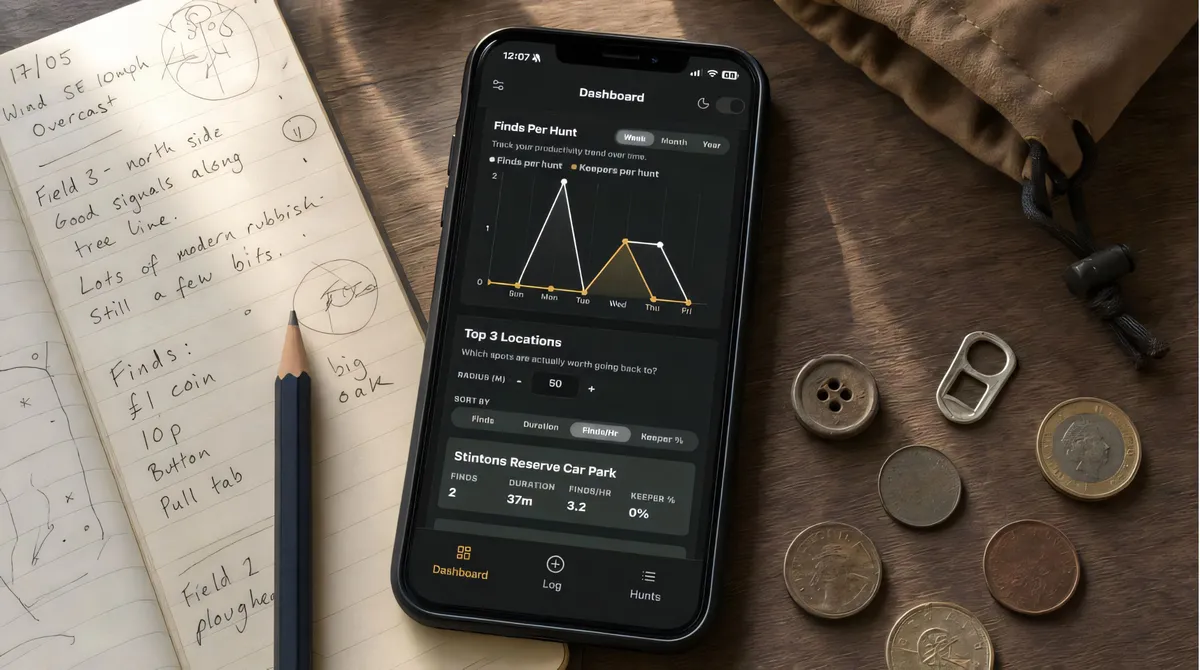
Memory is a terrible analyst. It remembers your best day in vivid detail and quietly forgets the forty average ones that actually hold the patterns. That’s the gap data fills. You don’t need to be a numbers person — you just need a handful of simple stats that turn dozens of hunts into clear, useful answers about where to go and what to do.
Here are the stats worth watching, and the decision each one should change.
Finds per hunt
The simplest measure of output: how many finds you’re averaging per trip. On its own it’s just a number, but tracked over time it shows whether you’re improving, and compared across sites it shows which ground is actually producing. Decision it changes: where to spend your next free afternoon.
Keeper rate
The share of your digs that are worth keeping. This is your efficiency signal — high keeper-rate sites reward your time; low ones might need a different approach or a pass. We cover the nuances in the keeper-rate guide. Decision it changes: whether a site’s worth returning to, and how you work it.
Hours per keeper
Finds per hunt and keeper rate don’t mean much without time. An hour for a keeper at one site versus four at another tells you where your effort actually pays. Decision it changes: how you budget your hunting time.
Top locations
Rank your sites by keepers, by keeper rate, or by total finds and the picture gets honest fast. The spot you think is your best often isn’t the one the data crowns. Decision it changes: which permissions to prioritise and which to retire.
VDI distribution
Chart the VDI numbers of your finds and the junk-versus-keeper ranges separate out — for your soil, not a generic chart. You learn which numbers to trust and which to treat with suspicion at each site. Decision it changes: your dig-or-skip calls in the field.
Depth bands
Group your finds by depth and a common blind spot appears: a lot of detectorists discover their keepers cluster shallow because they’ve been quietly skipping deeper, fainter signals. Decision it changes: whether to slow down and chase depth.
Conditions and settings
Line your results up against soil, weather, and your detector settings and the real relationships surface — which configurations correlate with keepers, how rain affects your depth, which soil types produce. Decision it changes: what you run, and when you go.
The minimum worth logging
You do not need to capture everything to get value from this. Almost every chart above runs off a small core:
Per hunt: date, site, and hours in the field. Per target: the VDI you saw, the depth, what it turned out to be, and whether it was a keeper.
That is it. Those seven fields power finds per hunt, keeper rate, hours per keeper, top locations, VDI distribution, and depth bands — six of the seven stats in this article.
Soil, weather, and settings are worth adding once the habit is established, because they unlock the correlation views. But a beginner who logs the core seven fields religiously will end up with far better data than one who designs an elaborate template and abandons it in March. Start small enough that you actually do it every time.
Small numbers lie
Here is the warning that belongs in every article about this subject and is almost never included.
With few hunts, everything looks like a pattern. Three visits to a site, one of which produced a silver coin, does not make it your best permission. Two keepers at 68 does not make 68 a good number. Human beings are extremely good at seeing structure in noise, and a chart makes noise look authoritative.
A rough guide: patterns start becoming trustworthy around ten hunts per site, and comparisons between sites need a similar depth on both sides. Before that, treat the numbers as a record rather than a conclusion. The log is still worth keeping from hunt one — you simply have not earned the right to draw a line through the points yet.
The related trap is comparing things that were never comparable. Six hunts at a park in summer against two at a field in February is not a fair fight, and the “winner” tells you about the season as much as the ground.
What the numbers do not tell you
Correlation arrives long before cause, and detecting data is riddled with confounders worth naming.
Your best site may just be your most-visited one. Total finds rewards frequency. Keeper rate and hours per keeper do not, which is exactly why they are the better ranking.
Your best settings may just be your fair-weather settings. If you run a particular configuration on dry, easy days and something else in the wet, the configuration will look brilliant and the weather did the work.
Improvement may be the site, not you. Clearing trash makes ground measurably easier to read over time. A rising keeper rate can mean you got better, or it can mean you removed two hundred bottle caps last season. Both are good — they just imply different things about what happens when you start somewhere new.
The fix is not statistical sophistication. It is simply asking, each time a chart tells you something flattering, what else would produce this shape?
Seasons show up in the data
One pattern that emerges reliably, and which almost nobody predicts correctly from memory, is timing.
Ploughed fields open up ground that was inaccessible all summer. Frozen or baked soil is miserable to dig and harder to read. Rain lifts conductivity and can change what your machine reports for weeks. On the coast, winter storms strip sand and expose layers that had been unreachable — the reason beach detectorists watch weather far more closely than inland hunters.
None of that is news. What the data adds is your version of it: which months actually produced for you, at which sites, rather than the general wisdom. After a couple of years, that turns into a genuine calendar — and planning around it is exactly what the hunt planner is for.
When the data says something you do not want to hear
It eventually will. The permission you love and have driven to forty times will rank fourth. The settings you have defended in a dozen conversations will show no advantage. A site you dismissed after one bad morning will quietly have the best hours-per-keeper figure you own.
This is the moment the whole exercise either pays off or gets quietly abandoned, and it is worth deciding in advance which it will be. Data you only consult when it agrees with you is not data — it is decoration.
The honest response is usually not to abandon the site you love. It is to change how you use it: fewer visits, or different ground within it, or a different time of year. The numbers rarely say “stop”. They say “you are spending your Saturdays in the wrong order.”
The point isn’t the chart — it’s the decision
Stats are only useful if they change what you do. For every number, ask the same question: what decision should this change? If the answer’s nothing, ignore it. If the answer’s “hunt the east field after rain with higher sensitivity,” that’s a stat earning its keep.
Let the app do the maths
Here’s the good news — you don’t build any of this by hand. Log your hunts and finds, and DetectingLog does the aggregation: dashboard stats, a top-locations leaderboard, finds per hunt, VDI distribution, depth-versus-keeper charts, and — with Premium — the settings effectiveness matrix, weather correlation, soil performance, and target-type trends. Export it all to CSV whenever you want.
Your only job is the part that takes a few seconds per hunt: logging consistently, tying finds to the spot they came from, and keeping it private. The patterns take care of themselves.
Frequently asked questions
What metal detecting stats are worth tracking?
The most useful are finds per hunt, keeper rate, hours per keeper, top locations, VDI distribution, depth bands, and how soil, weather, and settings line up with your results. Each one should change a decision — where to go, what to run, or how deep to dig.
How does data make you a better detectorist?
It surfaces patterns across dozens of hunts that no one can hold in their head — which sites actually produce, which settings work in which soil, and whether you're digging deep enough. You stop relying on gut feeling and start making decisions backed by your own history.
Do I need a lot of hunts before the stats are useful?
Patterns start emerging around ten hunts and get sharper from there. You don't need to backfill years of history — just log consistently from now on, and the data builds itself into something genuinely useful surprisingly fast.
What is the minimum I need to log for the stats to work?
Date, site, hours hunted, and for each target the VDI, depth, what it was, and whether it was a keeper. That handful of fields powers almost every useful chart. Everything else — soil, weather, settings — adds depth but is optional to begin with.
Keep reading
How to Document Finds with Photos, Notes, and Context
Good find records are worth more than the finds. Here is how to photograph, note, and contextualise your detecting finds — and why not to over-clean them.
How GPS Pins Help You Remember Productive Sites
Your memory loses your best detecting spots. Here is how GPS pins help you revisit productive ground — without exposing your sites to anyone else.
What to Record in a Metal Detecting Logbook
A good detecting log is a learning system, not a diary. Here is exactly what to record on every hunt so patterns and better finds follow.